|
|
|
|
|
|
|
|
|
|
- Sunburst chart
- Adding data into a chart
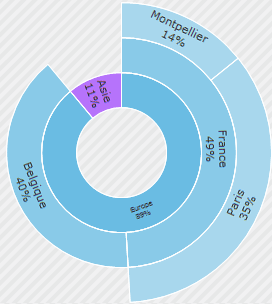
grSunburstAddData (Function) In french: grSMNAjouteDonnée Adds a data to a Sunburst chart. grSunburstAddData(GRF_Graphe, "Europe" + TAB + "France" + TAB + "Montpellier", 320000)
grSunburstAddData(GRF_Graphe, "Europe" + TAB + "France" + TAB + "Paris", 789000)
grSunburstAddData(GRF_Graphe, "Europe" + TAB + "France", 1109000)
grSunburstAddData(GRF_Graphe, "Europe" + TAB + "Belgique", 900000)
grSunburstAddData(GRF_Graphe, "Asie", 250000)
grDraw(GRF_Graphe)
 Syntax
grSunburstAddData(<Chart name> , <Section path> , <Value>)
<Chart name>: Control name or character string Name of the chart to be used. This name corresponds to:- the name of the chart defined programmatically with grCreate.
- the name of the Chart control in the window, page or report editor.
<Section path>: Character string Full path of the section that will be added into the chart. This parameter has the following format:
"<Name of base level>" + TAB + ["<Name of 1st level>" + TAB + ...
["<Name of last level>" + TAB + [...]]]"<Section name>"
For example, if the path contains "Europe + TAB + France + TAB + Montpellier", the data will be added on the third level of the chart below the "Europe\France\Montpellier" categories. <Value>: Real Value of the added part. This value must not be negative. Remarks Sunburst chart - If a level does not contain its own value, its value will be calculated by adding the values of sub-levels.
- If the sum of data for the sub-levels of a specific level exceeds the value of this level, an error will be returned when drawing the chart.
- The color of the sublevels is calculated automatically: this color is the same shade as the color of the main level, but paler.
Adding data into a chart grAddData is used to add data into a chart (pie, column, ...) Depending on the type of chart, specific functions can also be used to add data: Reminder: To add a value to a data item on a graph, use the grIncreaseData function. Business / UI classification: Neutral code
This page is also available for…
|
|
|
|
|
|
|
|
|
|
|
|
|
|
|
|
|
|
|
|